

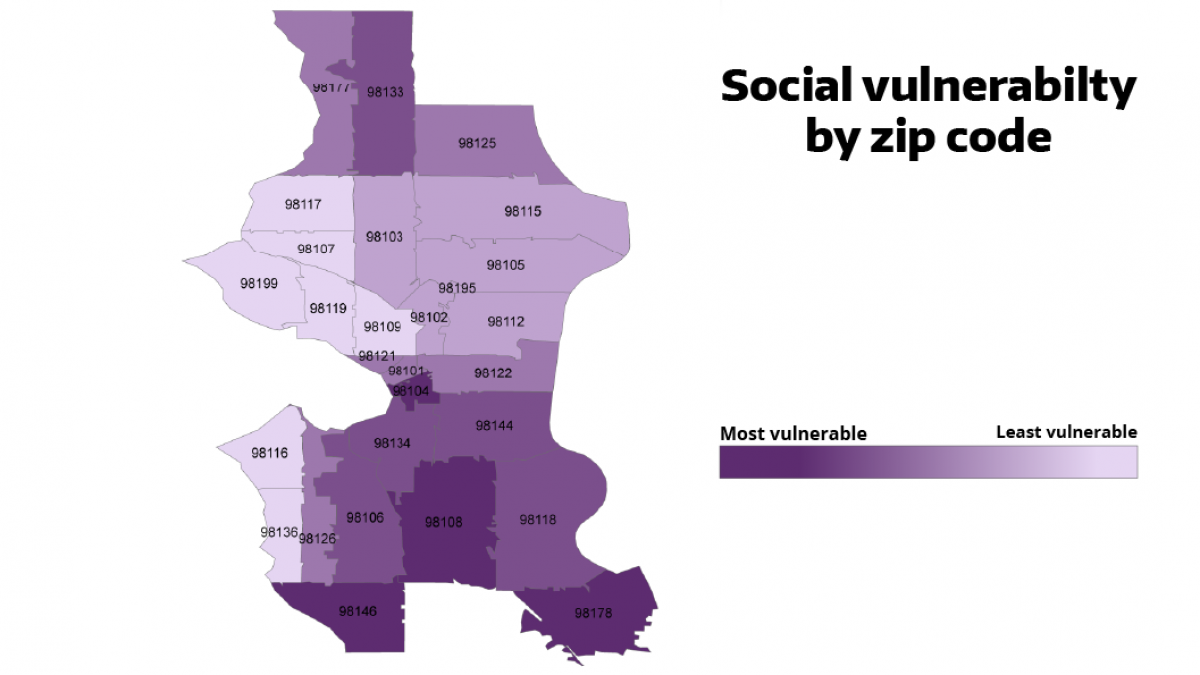
The new mapping tool developed by EDGE members shows Seattle zip codes by their level of vulnerability according to the CDC Social Vulnerability Index.
New mapping tool developed by EDGE members helps City of Seattle prioritize equitable access to COVID-19 vaccination
Seattle city officials are vowing to increase access to COVID-19 vaccines among people of color, immigrants and other groups disproportionately left out of vaccination efforts.

A new mapping tool will help the city pinpoint exactly where to place mass vaccination sites, mobile clinics and pop-up vaccine locations to improve access for groups underserved by current outreach efforts.
The tool, developed at the city’s request by the University of Washington Department of Environmental & Occupational Health Sciences (DEOHS), combines federal data on social vulnerability and census tracts with COVID-19 case rates to show where the most vulnerable may have the least access to vaccines.
DEOHS researchers have presented the information to the Seattle Mayor’s Office, which will use the data to target vaccination outreach by zip code, census tract or even block-by-block or door-to-door levels, said Edmund Seto, DEOHS associate professor and EDGE member.
Targeting limited vaccine supply
The new tool gives city and health officials access to at-a-glance information backed by the most up-to-date data to drive their decision-making.
“The University of Washington has been a strong partner to the city as we focus on disparities in vaccine distribution,” said Seattle Mayor Jenny Durkan in a statement. “This tool is critical to ensure our limited supply goes to communities who have been disproportionately impacted by COVID-19.”
The vast majority of people vaccinated by Seattle Fire Department mobile teams identify as Black, Indigenous or people of color, she said. Many also face systemic barriers to vaccination including mobility challenges, speaking a language other than English and being uninsured.
“Those who have been hit hardest by the pandemic should be the first to get vaccinated, and the City of Seattle—working with our partners—can and should lead in the way in equitable access,” Durkan said.
“The City will continue to use this tool to accelerate access to vaccines to the highest-risk communities in Seattle, especially as vaccine supply grows, allowing us to expand our mobile teams, create more pop-up clinics and open mass sites,” Durkan said.
A roadmap to equity
Equitable access to COVID-19 vaccines is a central component of public health planning at both the city and state levels.
The Seattle City Council passed a resolution Feb. 17 to improve vaccine access by reducing language, transportation, disability and digital literacy barriers that may stand in the way of at-risk populations getting vaccinated.
At the state level, the Department of Health’s interim vaccine plan is also focused on equity and how to use mapping tools such as the Washington Environmental Health Disparities Map to pinpoint underserved or undervaccinated communities.
“While this is being done at the state level, we recognized that mapping could be even more valuable at finer county and city levels,” Seto said.
Reaching the hard-to-reach

Esther Min, a DEOHS alumna and research consultant, is leading the work to develop the new mapping tool, which combines census tract information and data from the Social Vulnerability Index developed by the US Centers for Disease Control and Prevention.
The index examines factors such as socioeconomic status, household composition and minority status to assess community capacity to respond to and recover from disasters.
Min said a key takeaway from her research is the opportunity for the city to partner with community groups to set up pop-up vaccine clinics and do neighborhood-level outreach in areas identified on the map as being the hardest to reach.
Min’s work builds on her earlier research with DEOHS collaborators, funded by the UW Population Health Initiative, that found King County neighborhoods that are poorer and have higher levels of air pollution also tend to have higher rates of COVID-19 cases and lower testing rates.
The tool is also an extension of work by Min and Seto to create the Washington Environmental Health Disparities Map, an interactive tool that ranks Washington communities most impacted by pollution and other environmental health risks.