

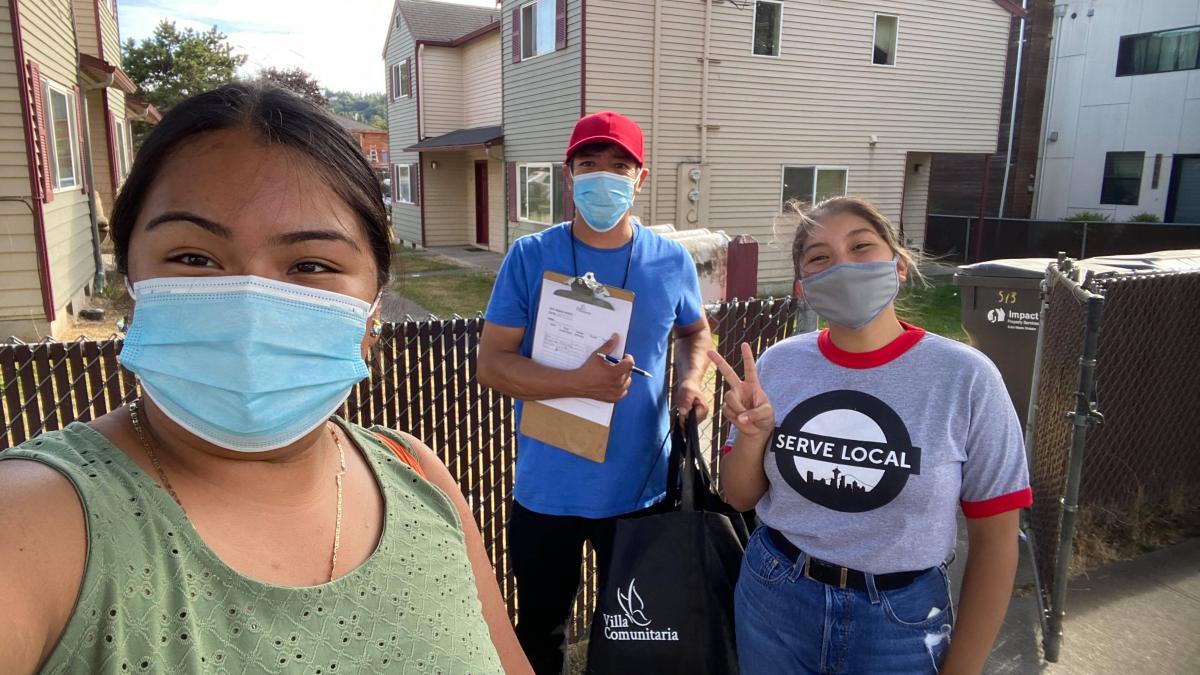
Community organizers go door to door in South Park to share information about free COVID-19 testing and environmental health. Photo: Duwamish River Cleanup Coalition.
King County neighborhoods with highest COVID-19 rates also face higher air pollution and socioeconomic inequities, EDGE research shows

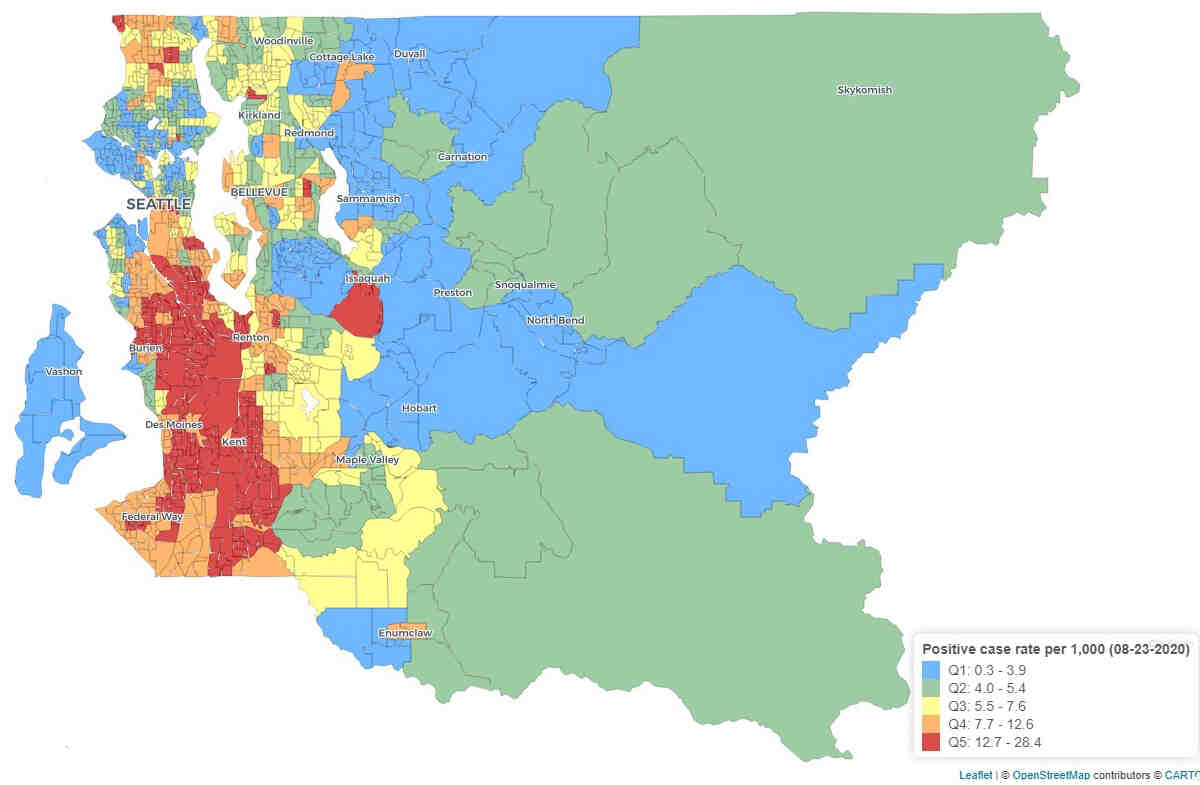
King County neighborhoods that are poorer and have higher levels of air pollution also tend to have higher rates of COVID-19 cases, according to new research by the UW Department of Environmental & Occupational Health Sciences (DEOHS) and collaborators.
These neighborhoods—mainly clustered in South King County—also have lower COVID-19 testing rates than the county average, as well as higher proportions of people of color and non-English speakers, the researchers found.
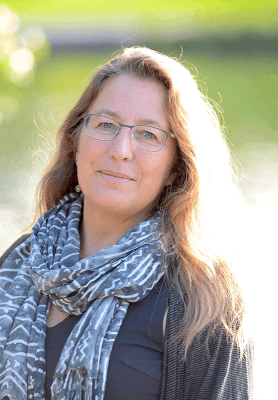
"We know there are health care, social and economic reasons for the inequities we are seeing with COVID-19,” said Stephanie Farquhar, clinical professor in DEOHS and the Department of Health Services, who is leading the project. “The data confirm what many of us in public health suspected as this began to roll out in January—that this virus is exacerbating other inequities."
Based on their results, the team identified the need for more testing centers in these neighborhoods—an effort that is now underway by Public Health–Seattle & King County (PHSKC).
The research was funded by a COVID-19 rapid response grant from the UW Population Health Initiative.
How pre-existing health disparities shape a pandemic
“Air pollution is already making asthma worse in my community, and now we have COVID-19. How do we get a handle on this?”
Early on in the pandemic, BJ Cummings began to get questions like these from community members in King County. Cummings is the community engagement manager for the UW Interdisciplinary Center for Exposures, Diseases, Genomics and Environment (EDGE), part of DEOHS.
These concerns—together with data from other US cities showing racial disparities in COVID-19 death rates—prompted the team to examine how environmental health and socioeconomic factors might influence COVID-19 risk and outcomes in King County.
The team focused on King County census tracts with 10% or greater COVID-19 positivity rates as of mid-July—64 of the 397 tracts.
They compared health and demographic data from PHSKC with results from the Washington State Department of Health’s Environmental Health Disparities Map, which Min and other DEOHS researchers had previously developed to rank communities across the state according to their cumulative environmental health risk.
The map is a free online tool that features customizable map views of risk factors including environmental exposures such as heavy traffic, environmental effects such as proximity to hazardous waste, socioeconomic factors such as education and affordable housing, and indicators of sensitive populations such as deaths due to cardiovascular disease.
The long shadow of air pollution
The research team found that 83% of the 64 tracts with high COVID-19 rates were also highly impacted by environmental health disparities, with a ranking of 9 or 10 out of 10 on the disparities map.
One of the most prominent environmental factors underlying these trends was fine particulate matter, or PM 2.5, with 80% of tracts with high COVID-19 rates also having the county’s highest concentrations of PM 2.5. Since long-term exposure to fine particulate matter can increase risk for respiratory disease, this exposure may also influence COVID-19 outcomes, said Esther Min, a DEOHS research consultant who is part of the research team.
Socioeconomic inequities matter
Additionally, 92% of the 64 census tracts with the highest rates of COVID-19 had more people living below 200% of the federal poverty level than the county average, and many were in predominantly Hispanic and Black neighborhoods.
In future research, the team plans to examine some of the root causes of these correlations.
"The disparities are very clear, and there are many possible explanations for them—occupations that cannot be done remotely or require close contact with the public, crowded housing, distrust in healthcare and reduced access to services that have been closed because of COVID restrictions," Farquhar said.

Unequal access to COVID testing
Eight in ten of the census tracts with the highest levels of COVID-19 infection also had lower COVID-19 testing rates than the county average.
In Cummings’ conversations with community members in some of these neighborhoods, the need for accessible testing was clear. “We were hearing: ‘I don't have a car. If I have to get on a bus, I'm not going to get tested,’” Cummings said.
Since the study began, “PHSKC is responding to higher positivity rates and putting more mobile and testing centers in these communities,” Min said.
PHSKC has also separately developed a set of COVID-19 data dashboards showing COVID-19 outcomes by race and ethnicity and other factors.
The UW team is working with PHSKC to discuss incorporating environmental health indicators into these data dashboards. Researchers are also sharing their results with community groups in these neighborhoods to get their feedback on potential health interventions to lower COVID-19 rates, as well as future research directions.
The research team also includes Carolyn Ingram, research intern, and EDGE member Edmund Seto.