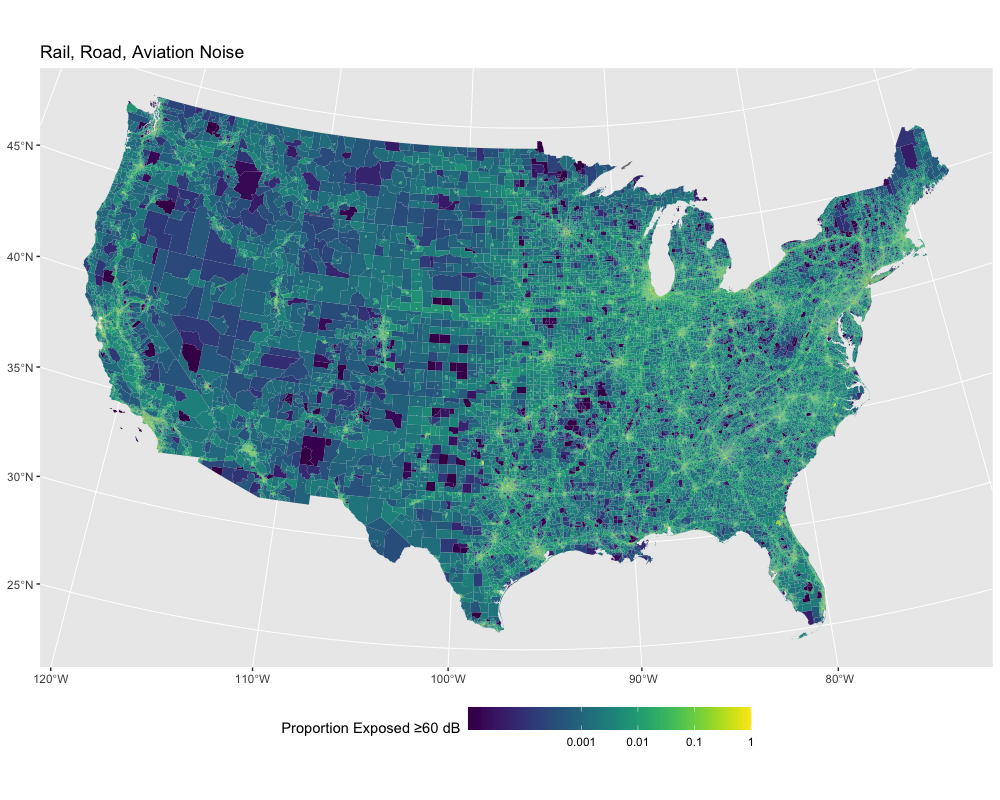
The National Transportation Noise Exposure Map was created by overlaying the Bureau of Transportation Statistics' Year 2020 National Transportation Noise Map with 5-year (2016-2020) population data at the block group level from the Census Bureau's American Community Survey. Transportaiton noise levels were modeled by the BTS for road, rail and aviation traffic. Numbers of people and the proportion of the population exposed to different levels of noise were computed for block groups, and then reaggregated to the census tract level. These tract-level maps can facilitate health impact assessments, integration with other census tract sociodemographic data, and exposure assessments for epidemiologic and environmental justice studies.
For details on the methodology and findings related to noise exposures, see Edmund Seto and Ching-Hsuan Huang preprint paper:
Seto and Huang (2023), The National Transportation Noise Exposure Map, medRxiv 2023.02.02.23285396; https://doi.org/10.1101/2023.02.02.23285396
From the Abstract...
Based on the exposure map, an estimated 94.9 million people (29.1 % of the total U. S. population) were exposed to ≥45 dB LAeq of transportation-related noise, and approximately 11.9 million (3.6 %) were exposed to ≥60 dB in the year 2020.
For an application of the data, please see this peer-reviewed study using the noise exposure data to estimate high annoyance to transportation-related noise in the United States for different racial and ethnic groups:
Huang and Seto (2024), Estimates of Population Highly Annoyed from Transportation Noise in the United States: An Unfair Share of the Burden by Race and Ethnicity, Environmental Impact Assessment Review, 104, 107338. https://doi.org/10.1016/j.eiar.2023.107338
From the Abstract...
Hispanic populations had the greatest share of high annoyance from aviation noise. Black and Asians had the highest rail and road noise annoyance share, respectively.
Interactive Map
An interactive map that you can zoom and search is available via the link below. The map shows proportions of the population exposed to noise LAeq ≥50 dB.In the interactive map, we also included locations of ports and military bases, where noise in surrounding community may be underestimated due to the limitations of the BTS modeling.
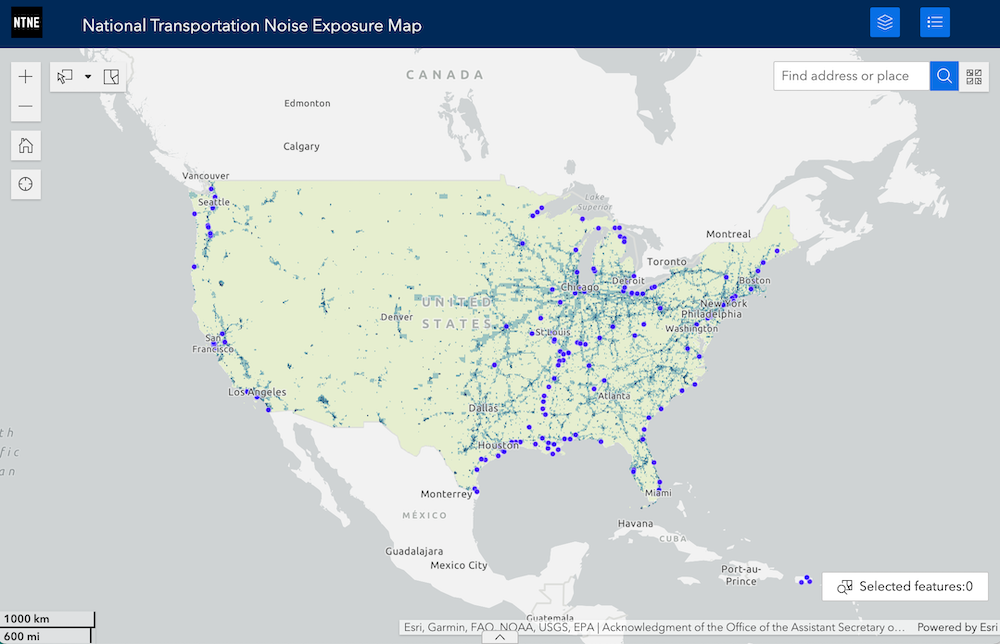
Take me to the interactive map
Access Data
Tract level data for this map are available in R sf data and shapefile formats. These data quantify population exposures to different noise level categories of LAeq 45-50, 50-60, 60-70, 70-80, 80-90, and 90+ dB. Additionally, from these data, it's possible to compute population-weighted exposures for census tracts that can be used in analyses that need a single summary measure of exposure at the census tract level. Instructions on computing population-weighted noise exposure is provided on webpage for downloading data.
To access the links to data, please tell us a bit about yourself. It's helpful for us to know who's using the map.
Detailed Exposures
For address and point location-level or alternative neighborhood-level noise exposures, or more refined exposures than 10 dB categories, please contact Dr. Seto at the email address below.
Questions
Lead photo above by Antonio Janeski on Unsplash