Introduction
The purpose of this page is to provide additional educational information to participants of the Healthy Air, Healthy Schools study. The study was funded by the Washington State Legislature and five cities near Seattle-Tacoma International (Sea-Tac) Airport. The study was led by the UW Department of Environmental & Occupational Health Sciences and the Department of Civil and Environmental Engineering. The study was motivated by an earlier study called the Mobile ObserVations of Ultrafine Particles (MOV-UP) study, which found that communities near and underneath the Sea-Tac Airport flightpaths were exposed to ultrafine particles (UFPs) associated with aircraft emissions. UFPs are very small particles that can be breathed in and enter the body’s lungs and/or blood vessels, potentially causing disease. Other studies in Los Angeles and Boston have also found that concentrations of UFPs are higher near major airports.
Particulate Matter
What is particulate matter?
Particles come in many sizes and shapes and can be made up of hundreds of different chemicals. Particulate matter (also known as particle pollution or PM) is a complex mixture that contains small solid particles and liquid droplets. One way of describing particle pollution is by size:
Figure 1. Size Comparisons of Particulate Matter
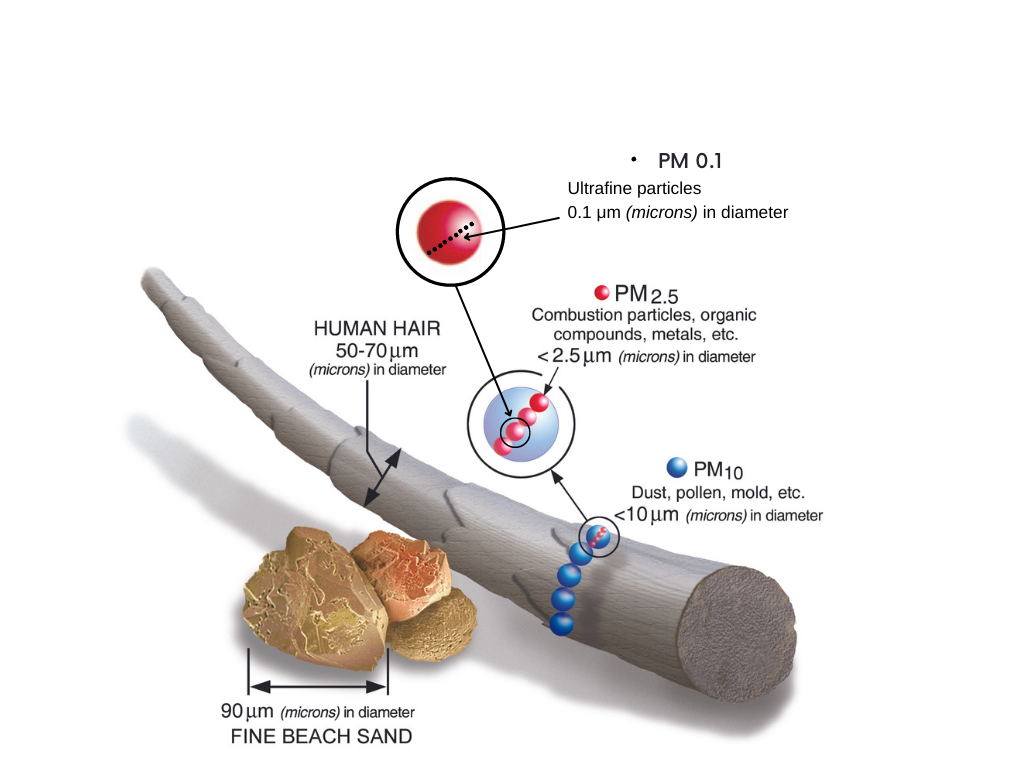
Coarse Particulate Matter (PM10)
PM10 includes coarse particles with diameters between 2.5 and 10 (μm) microns. These particles are about the size of dust, pollen, or mold. Particles of this size will settle out of the air within a few hours2.
Fine Particulate Matter (PM2.5)
PM2.5 includes fine particles with diameters less than 2.5 microns (μm). PM2.5 is found in smoke and haze and can be directly emitted from sources such as wildfires and automobiles. The chemical composition of PM2.5 is typically vastly different than coarse particles. PM2.5 will settle slowly from the air and its removal from the atmosphere can take days2.
Black carbon (BC) is a major component of “soot” and is directly emitted into the atmosphere in the form of fine particulate matter. BC is formed by the incomplete combustion of fossil fuels, biofuels, and biomass3. BC is often highest near major roadways, in particular vehicles using diesel fuel.
Ultrafine
Ultrafine particles (UFPs) are particles with diameters less than 0.1 microns (um) (or 100 nanometers). UFPs form during combustion. These particles are stable in the atmosphere but will join other particles by colliding and adhering to larger particles (coagulation), adhering to similar particles (agglomeration), or adhering to different particles such as droplets (conglomeration)2. These nanoparticles are removed from the air when they have formed into larger particles2.
What makes UFPs different?
Unlike PM2.5 and PM10, UFPs are not regulated by the United States Environmental Protection Agency (US EPA). The National Ambient Air Quality Standards (NAAQS) are based on research regarding their effects on health and welfare (quality of life and our economy)4. They are called “criteria” air pollutants because the EPA sets NAAQS based on the criteria of the latest scientific information regarding their effects on health or the environment5.
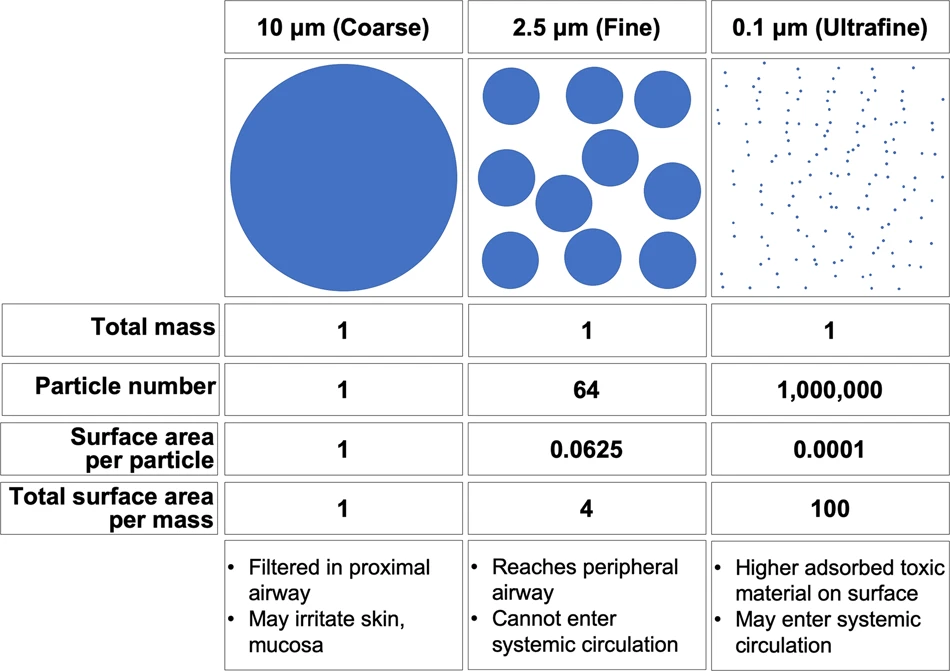
UFPs are challenging to characterize over space and time because their concentrations decrease sharply downwind from sources and UFPs shift in size with time and distance from their emission source through agglomeration and condensation6. The large surface area of UFPs allows them to carry large quantities of adsorbed hazardous materials, including organic chemicals and metals that can generate oxidative stress6. The small size of UFPs also allows them to evade the immune system and deposit in the lung at a higher rate than PM2.5. For the same volume of air inhaled, the actual dose and regional effects of UFPs in the lung might be significantly greater than that of PM2.56.
Figure 2. Unique Features of Ultrafine Particles
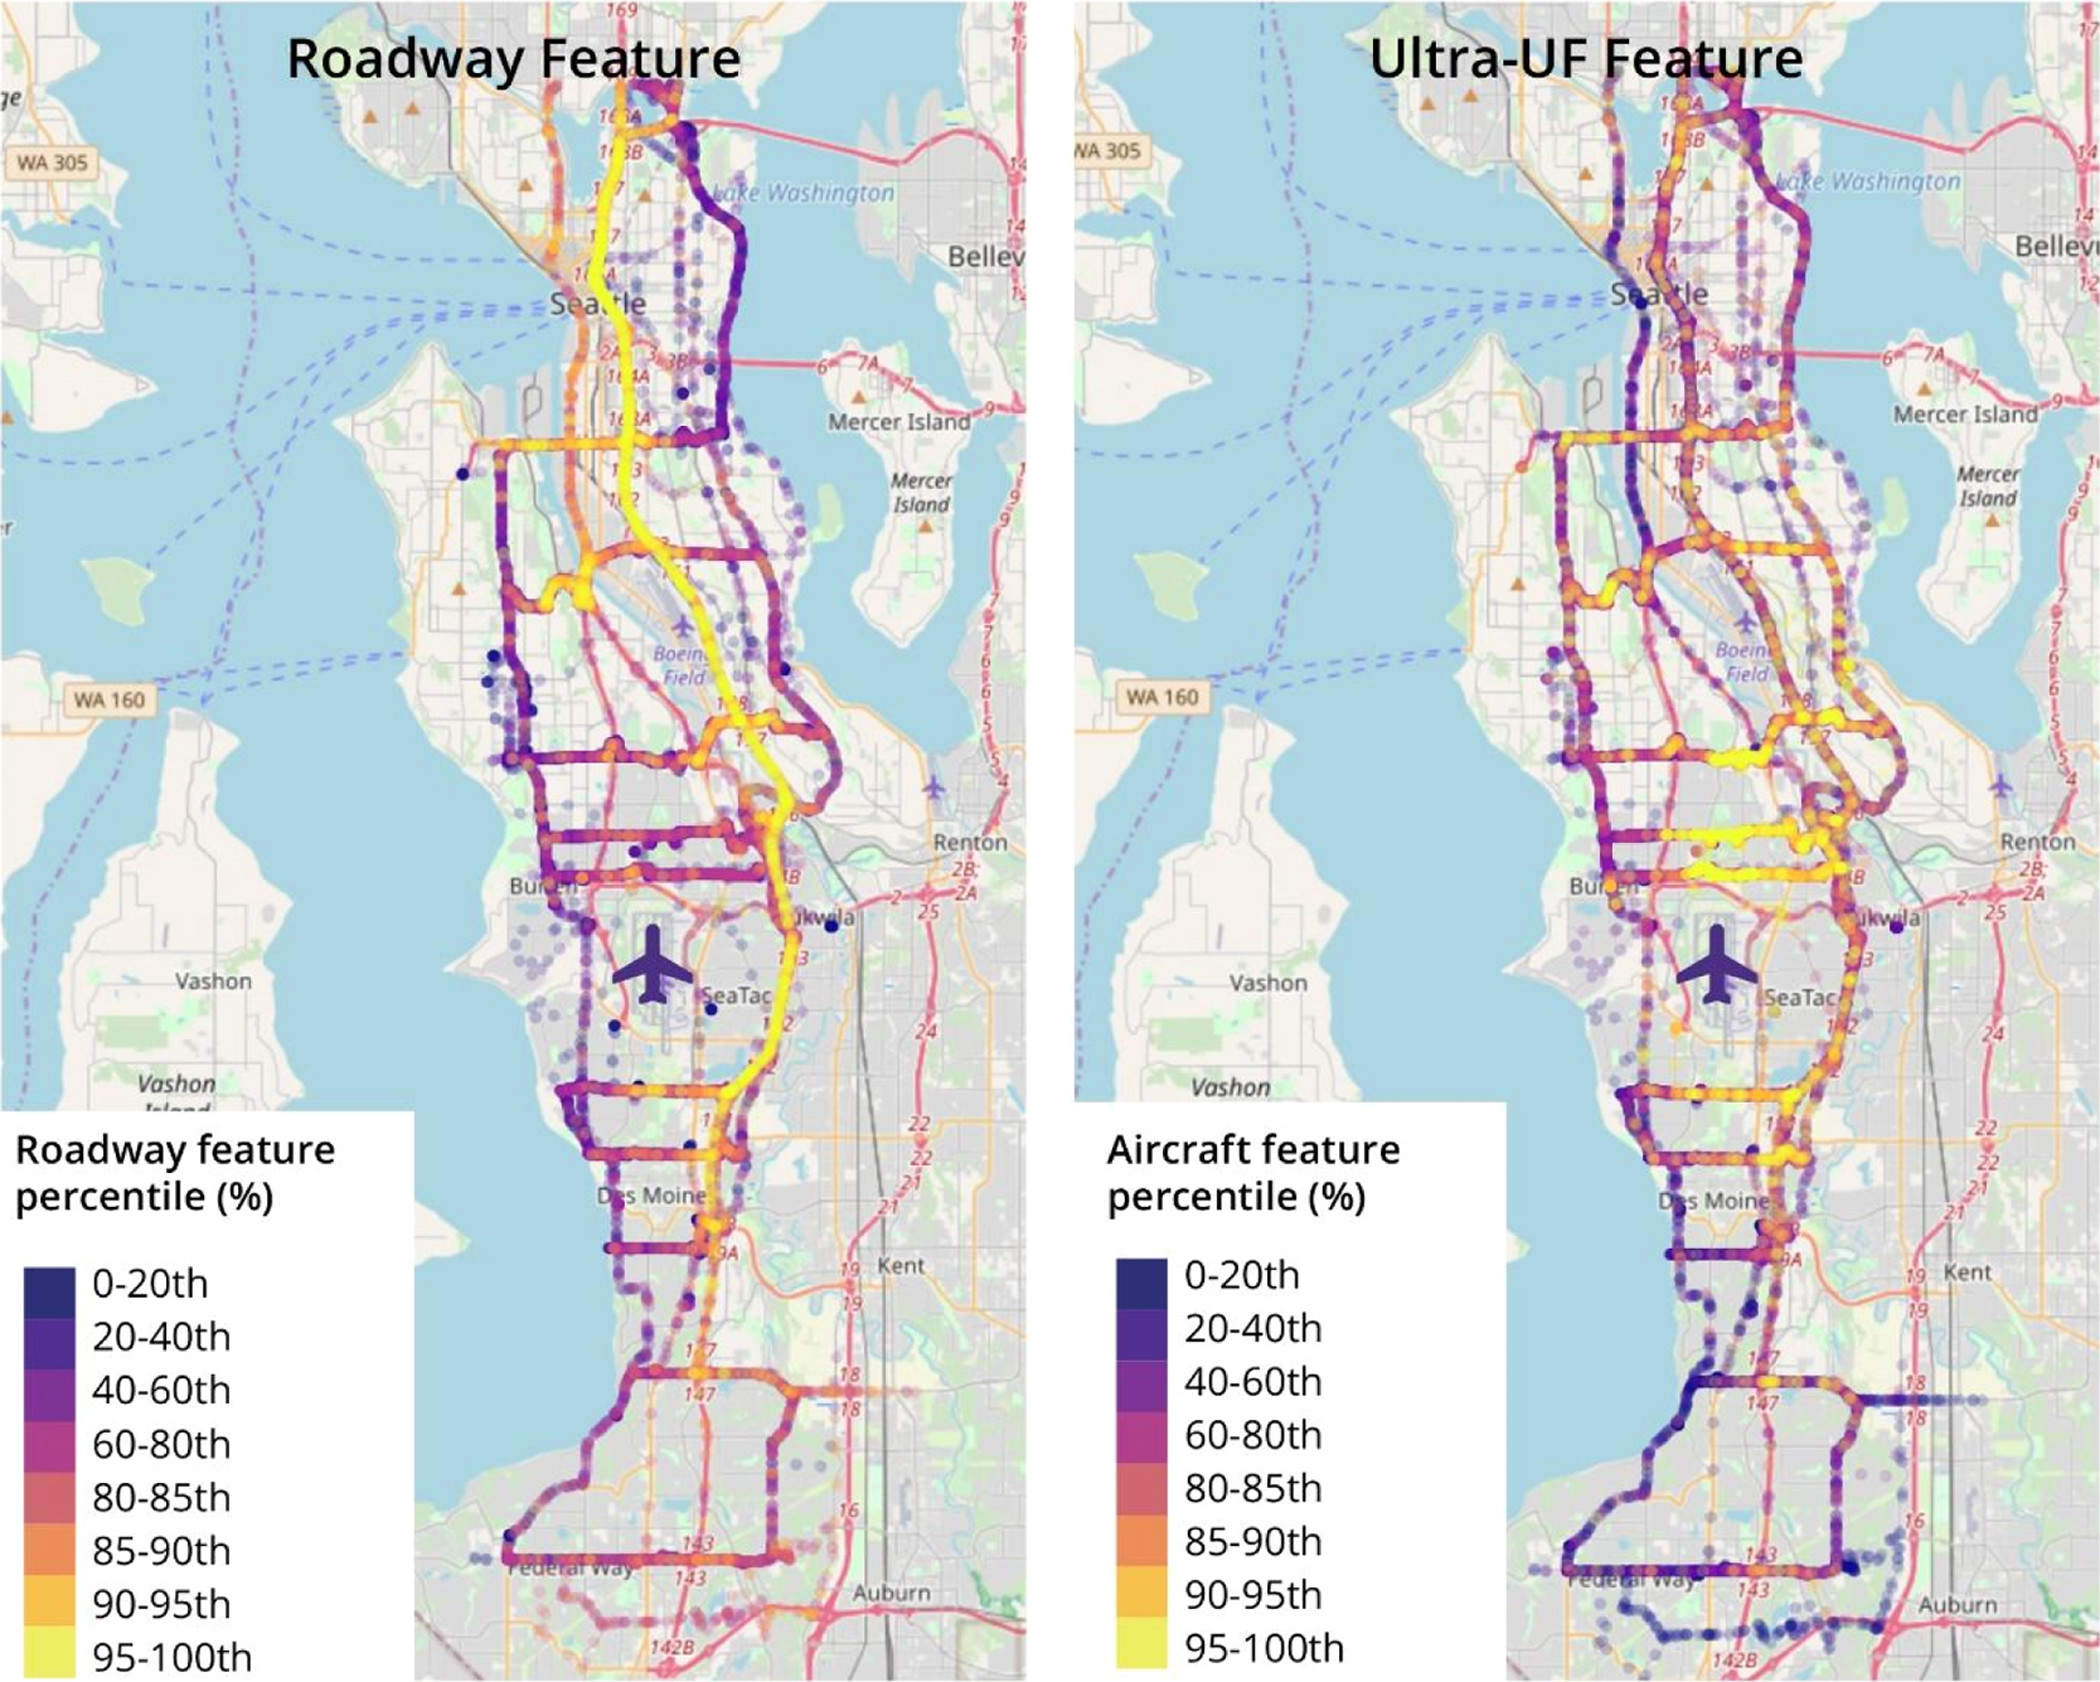
UFPs vary over space and time differently than PM2.5 or PM108. Some neighborhoods may be more exposed to UFPs than others if they are close to roadway traffic or overlap with the plumes from aircraft emissions9. The University of Washington’s Mobile ObserVations of Ultrafine Particles (MOV-UP) study found that UFP sources can be distinguished by particle size and black carbon concentrations9. Landing aircrafts tend to have a higher emission rate of small 10–20 nm particles compared to roadway particles9,10. Roadway traffic consists of larger UFP sizes (>25 nm)11 and high BC concentrations9. Previous studies, in Los Angeles and Boston, have also found that concentrations of UFPs are higher near major airports10,12. In Los Angeles, elevated concentrations of UFPs underneath the aircraft landing paths of the LAX airport and the concentrations of UFPs at the ground level near the airport runway tended to consist of smaller particles in the range of 10–20 nm10.
Figure 3. Sources of Ultrafine Particles near Seattle-Tacoma International Airport
Health Effects
What are the health effects of UFPs?
Knowledge about the short-term and long-term health effects of UFPs is still relatively limited. Uncertainties remain due to : (1) limited information on how UFP concentrations vary across time and space; (2) the lack of a UFP monitoring network in the U.S.; and (3) insufficient data on the composition of UFPs13. Monitoring campaigns have demonstrated a high degree of spatial variability in UFP concentrations and shown that the size distribution of UFPs changes with distance from a source13.
Particle size and health
The effects that particles have depend on where the particles interact with the body. Particle size is the main factor determining where the particle will lodge once inhaled2,14.
Figure 4. Deposition of Particles into Lungs
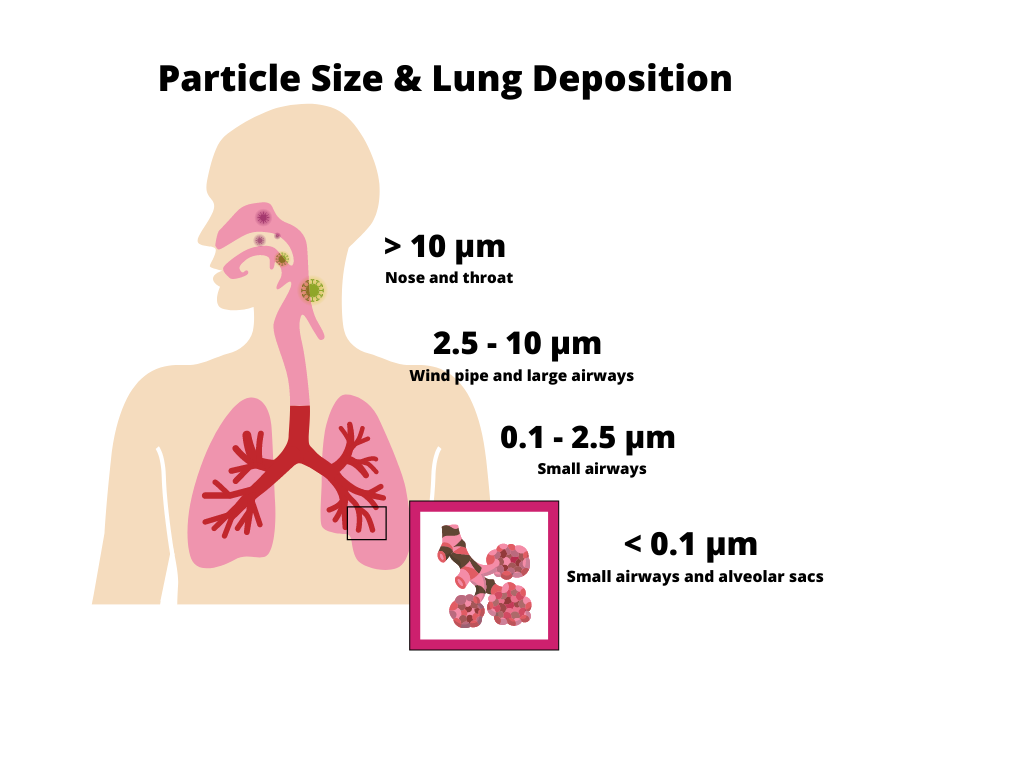
- Most particles larger than 10 μm are not inhaled into the lungs and are instead filtered by the nose and throat.
- Coarse particles (2.5 to 10 μm) can reach the bronchi and lungs and cause respiratory problems.
- Fine particles (0.1 to 2.5 μm) can reach the bronchioles and enter the blood stream, leading to an immune system response that can result in cardiovascular problems.
- Ultrafine particles (less than 0.1 μm) can reach the small bronchi and alveolar sacs.
New research has found that there are potentially different health effects from particles smaller than PM2.5. UFP exposures have been linked to a variety of outcomes including breast cancer15, ischemic heart disease16,17, prostate cancer18, asthma, and COPD19. The health effects of aircraft-related UFP exposure may also be different from roadway traffic UFP exposures9. Pulmonary function tests can be conducted to determine the respiratory impacts of UFP exposures. Pulmonary function testing includes forced vital capacity (FVC) and forced expiratory volume in one second (FEV1)20. One study in Los Angeles found that aircraft-related UFPs were associated with elevated systemic inflammation (IL-6), whereas roadway traffic is more associated with impaired respiratory health (lower FEV1) and inflammation in healthy adults with mild to moderate asthma20. Respiratory health effects have also been found to occur in non-asthmatic healthy adults21. Short-term exposure to high levels of UFP, on average, have been associated with decreased lung function (mainly FVC). Cardiovascular tests can also be conducted to determine the cardiovascular impacts of UFP exposures. Heart function tests include electrocardiography (ECG) to examine repolarization of the heart. ECG tests indicate that a single 5-hour exposure of UFPs was associated with prolonged repolarization of the heart (QTc).
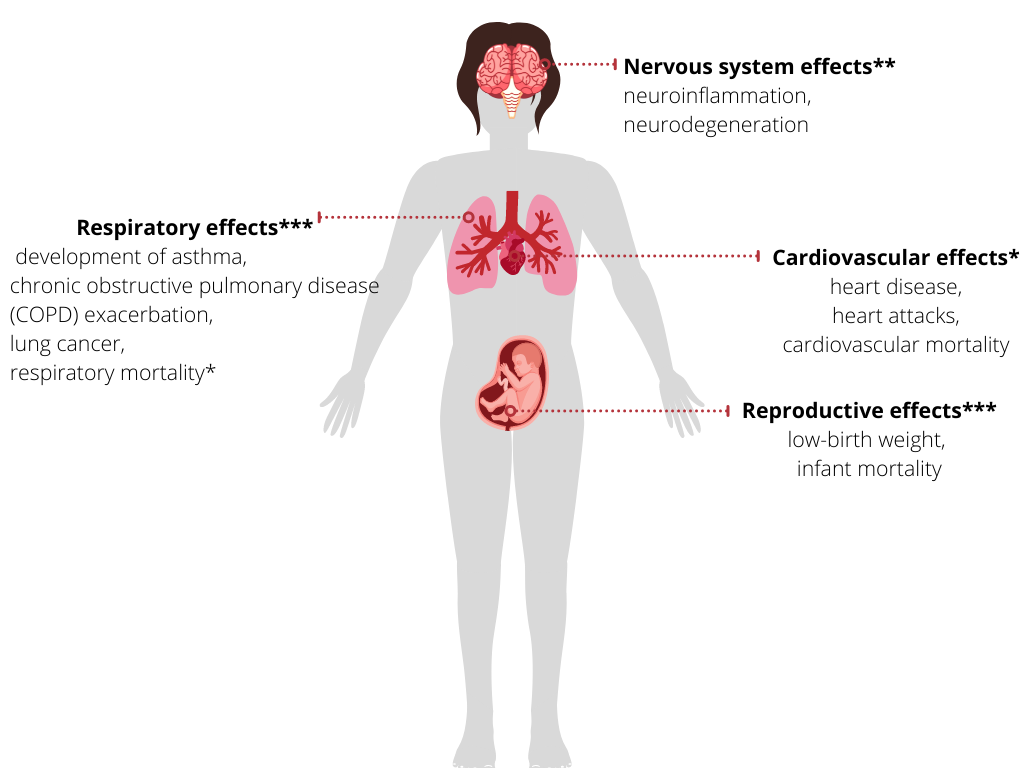
Figure 5. Short-term effects of Ultrafine Particles
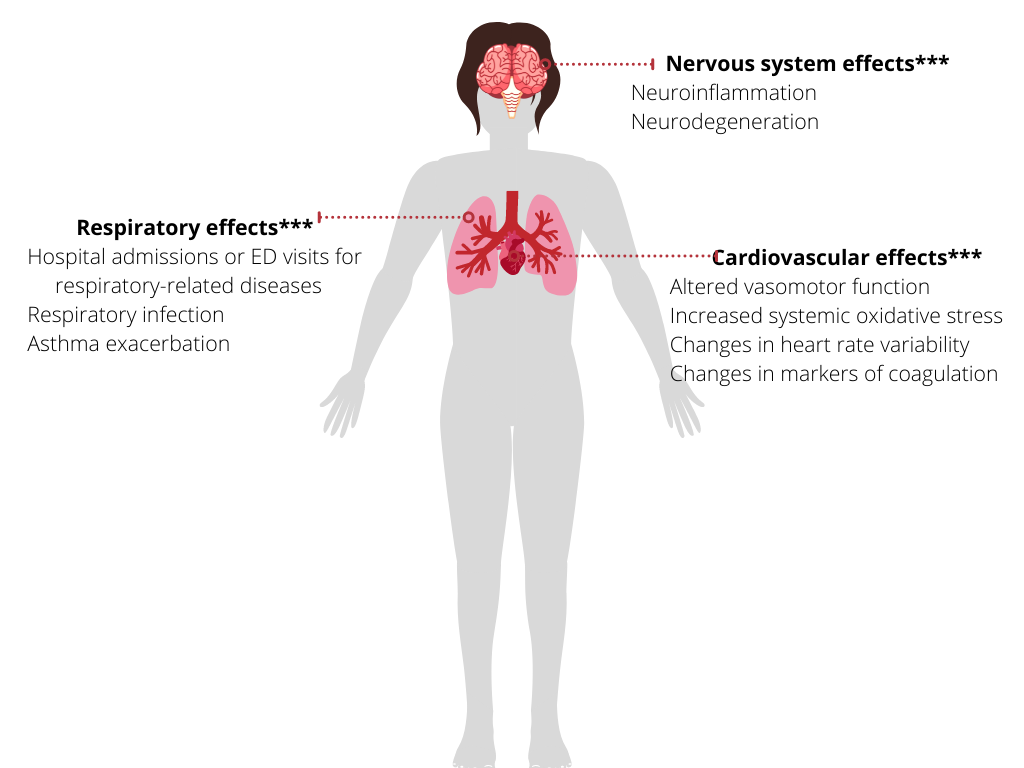
In addition to respiratory effects, there is evidence from new animal toxicological studies of nervous system effects from short-term and long-term exposures, including brain inflammation and oxidative stress, morphologic changes, behavioral, and neurodevelopmental effects13. Several animal toxicological studies provide evidence for brain inflammation and oxidative stress following short-term exposure to UFP13. In utero exposure to aircraft-origin UFPs was positively associated with preterm birth22.
In addition to respiratory effects, there is evidence from new animal toxicological studies of nervous system effects from short-term and long-term exposures, including brain inflammation and oxidative stress, morphologic changes, behavioral, and neurodevelopmental effects13. Several animal toxicological studies provide evidence for brain inflammation and oxidative stress following short-term exposure to UFP13. In utero exposure to aircraft-origin UFPs was positively associated with preterm birth22.
Indoor Air Quality
What is indoor air quality?
Indoor air quality depends on a building, its location, climate, uses, and occupancy. The quality of indoor air can vary from much worse to much better than outdoor air. Indoor air quality can be affected by outdoor air quality, maintenance, furnishings, temperature, humidity, and moisture.
Typical indoor air pollutants of concern are carbon monoxide, carbon dioxide, ozone, radon, asbestos, volatile organic compounds (VOCs), molds, allergens, bacteria, and tobacco smoke.
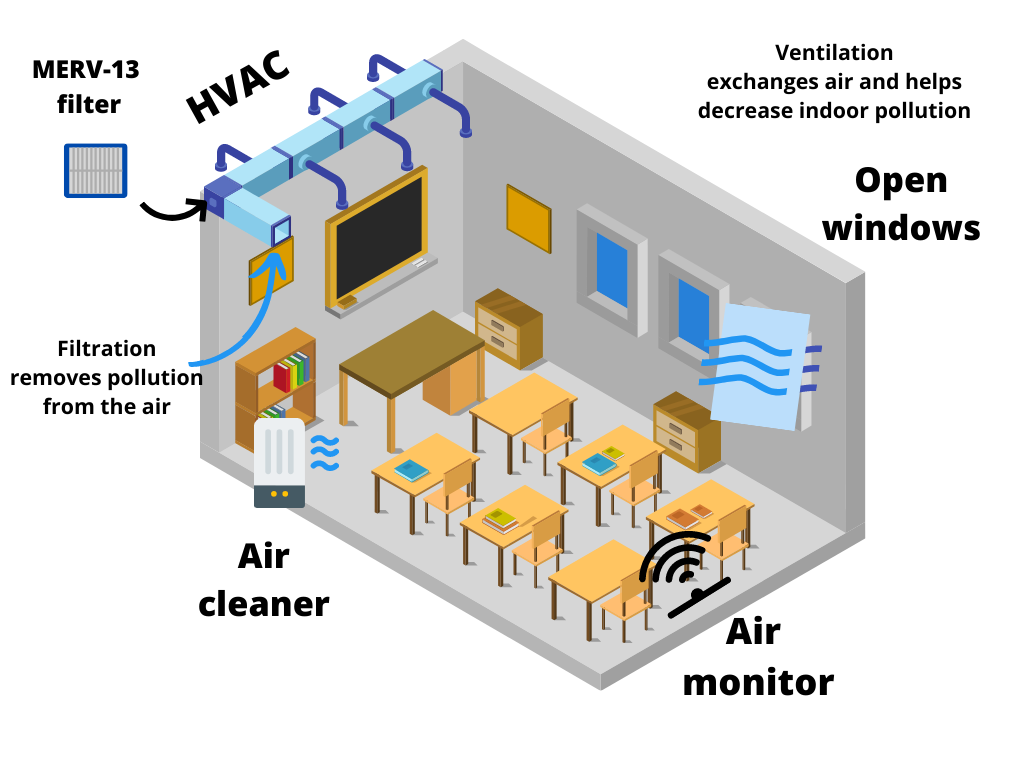
Figure 6. Movement of Air in a Classroom
How does ambient pollution get indoors?
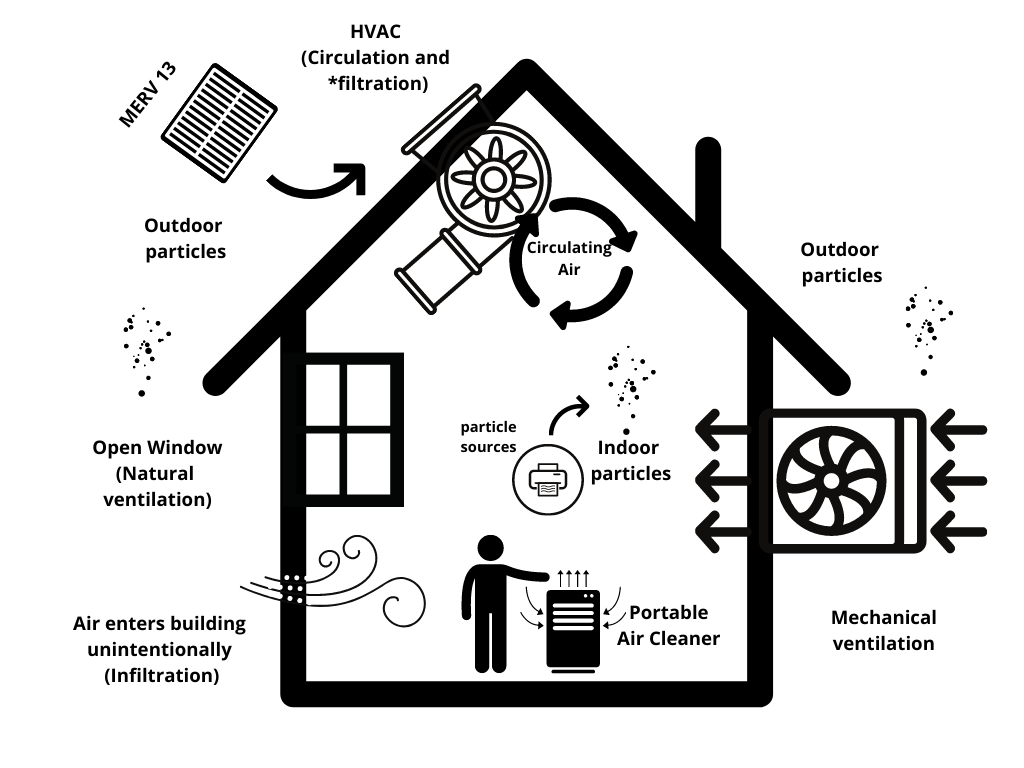
Air exchange can occur through ventilation, filtration, and infiltration. In a “best case” scenario, outdoor air will be exchanged with indoor air and indoor air will be filtered.
Figure 7. Movement of Ambient Air Pollution into the Indoor Environment
In a best case scenario ventilation and filtration will help reduce the amount of indoor particles.
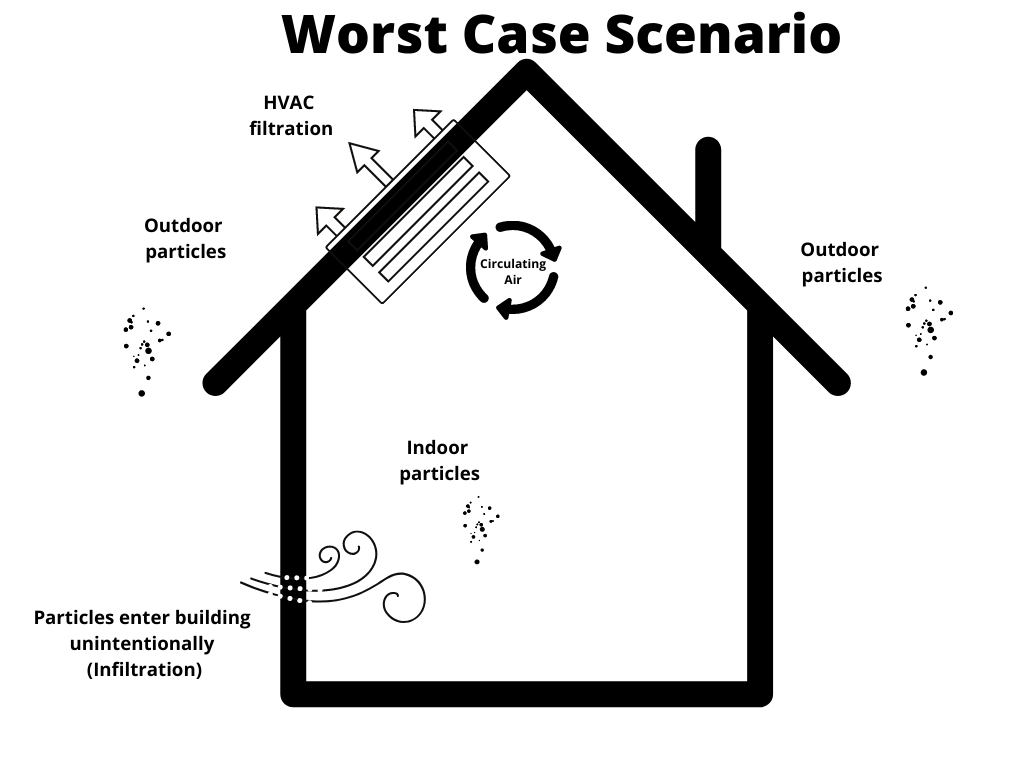
In a worst case scenario poor ventilation and infiltration will negatively impact indoor air quality.
Infiltration
Infiltration is the unintentional movement of pollutants in the outdoor air to indoors. Air can enter through cracks in the building and by openings in windows and doors. Reducing infiltration can also lower energy costs by reducing the energy consumption required for the HVAC system. In the “worst case scenario”, we see that particles unintentionally move from the outdoors to indoors.
What does the Air Exchange Rate tell us?
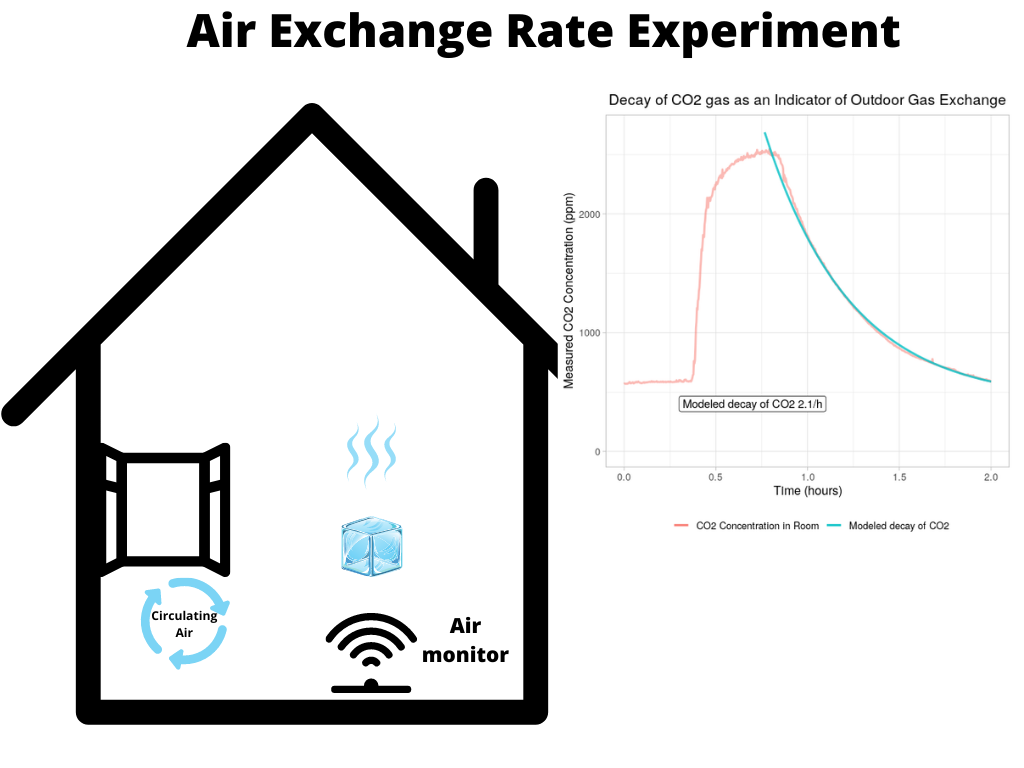
The air exchange rate (AER) tells us how many times per hour the air indoors will be replaced with the air outdoors. The number of exchanges per hour is the “ACH”. Using dry ice, we can determine the air exchange rate in a room. This experiment does not measure the air circulated through the HVAC system.
Figure 8. Calculating Air Exchange Rate: Carbon Dioxide Experiment
Improving Indoor Air Quality
What are solutions to reduce indoor air pollution?
Ventilation
Figure 9. Ventilation graphic
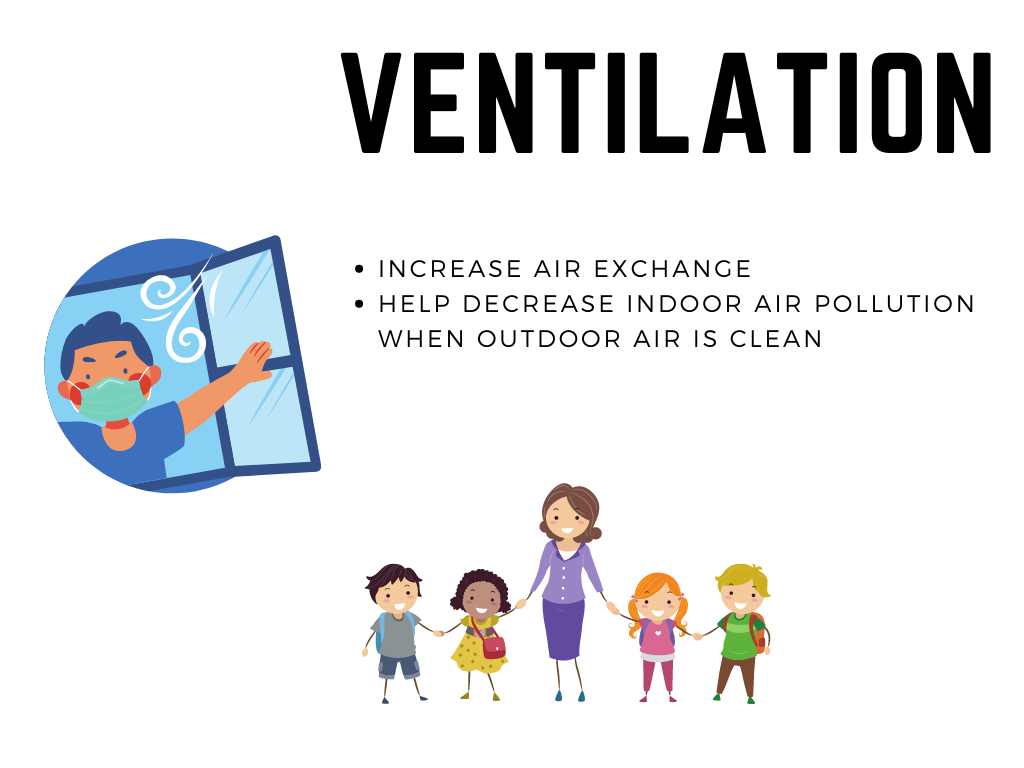
A heating, ventilation, and air conditioning (HVAC) system conditions air and has the potential to remove particles from a building. Conditioning the air can change the temperature, replenish oxygen, and remove moisture, odors, smoke, carbon dioxide (CO2), and other gases.
Not all HVAC systems filter air but they will keep indoor air circulating and prevent stagnation. Introducing outside air is important because it can replenish oxygen while removing CO2. The HVAC system will recirculate the air and exchange indoor air for outdoor air. In the “best case scenario” we see that outdoor air enters the HVAC system, is conditioned, and then exits into the building. Indoor air also enters the HVAC system to be conditioned before returning to the building.
Filtration
Figure 10. Filtration graphic
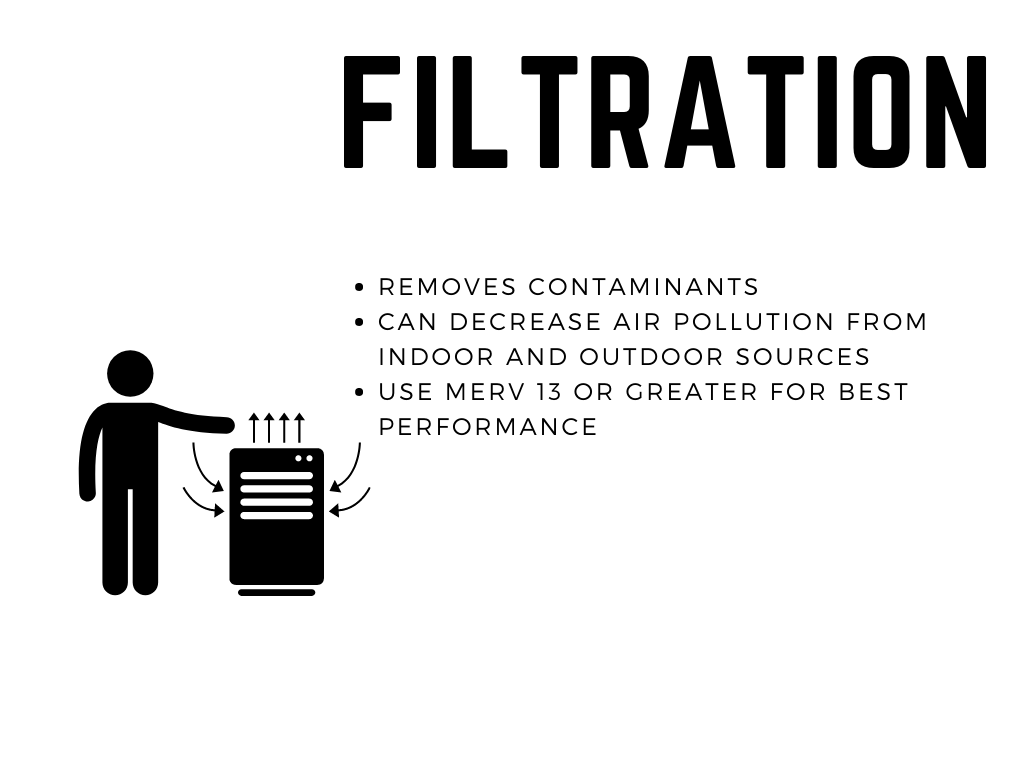
Filtration removes particles from the air. Air can be filtered in a building through the HVAC system or in a single classroom with a portable air cleaner. Portable air cleaners with high efficiency particle air (HEPA) filters can improve indoor air quality by removing particulates from the air. A HEPA filter is a pleated mechanical air filter that can remove at least 99.97% of dust, pollen, mold, bacteria, and any airborne particles with a size of 0.3 microns. Filtration is important in decreasing air pollution from indoor and outdoor sources. The University of Washington Interdisciplinary Center for Exposures, Diseases, Genomics & Environment (EDGE) has developed a short factsheet on the use of HEPA air purifiers in schools.
How do you select an air filter?
Look for air purifiers with the correct Clean Air Delivery Rate (CADR) for the size of your space. Prioritize units that have been AHAM certified, meaning that independent labs have verified that they clean air as well as the manufacturer claims they do. Also look for CARB-certified air cleaners that have been certified to not release high levels of ozone that would harm asthmatics.
Where should you place an air filter?
A HEPA air purifier needs to be placed away from walls in order to allow for proper air circulation. If the unit must be near the edge of a room, make sure it’s at least the length of an average cell phone away from the wall. Ideally the unit would sit as close to the breathing space of the people in the room as possible. Most air purifiers have a limited ability to move air, so placing a fan in the room can increase their efficiency.
If possible, turn the unit on an hour before the classroom will be used. Turn it off overnight and if noise becomes disruptive. It’s best to keep windows and doors closed while the air purifier is on.
How do you maintain an air filter?
Over time, HEPA filters clog, requiring cleaning and eventual replacement. The exact timing of cleaning and replacement depends on the brand of the unit, how heavy its use, and the environmental conditions under which it has been operating.
Check the manufacturer’s guidelines to find out how often to clean and replace your filters. In general,expect to vacuum the filter and wipe down the exterior with antibacterial wipes as often as every two weeks. Filters will likely need to be replaced every three to 12 months. If possible, consider training staff to perform regular filter maintenance and replacement, and establish a routine schedule with calendar reminders to ensure that filters are changed as needed.
Air Pollution Sources
How does pollution get into the air?
Figure 11. Air Pollution Sources Impacting the Greater Seattle Region
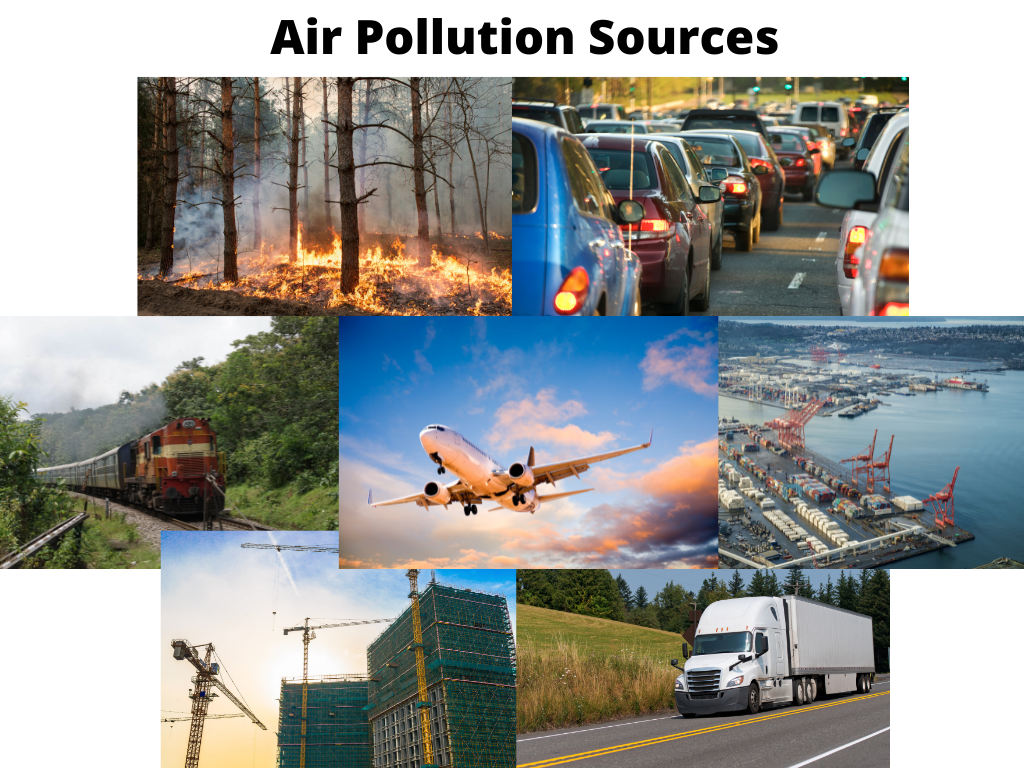
Some particles are emitted directly from a source or are in the atmosphere because of chemical reactions. These include chemicals such as sulfur dioxide and nitrogen oxides, which are pollutants emitted from power plants, industries, and automobiles.
Some sources of particulate matter are23:
- Woodsmoke
- Unpaved roads
- Construction sites
- Cars
- Trucks
- Railways
- Aircraft
How does fine particulate matter impact health?
Exposure to particulate matter has been linked to several health effects24,25. These include:
- Increased respiratory problems such as irritation of the airways, coughing, and difficulty breathing
- Decreased lung function
- Exacerbation of respiratory and cardiovascular disease
- Development of chronic bronchitis
- Low birth weight
- Infant mortality from respiratory issues
- Premature death in people with heart or lung disease
Sensitive populations are more vulnerable to adverse health effects. Sensitive populations include children, older adults, and people with heart or lung disease. Children may be particularly at risk for health effects related to ambient PM2.5 exposures compared with adults because they have (1) a developing respiratory system, (2) increased ventilation rates relative to body mass compared with adults, and (3) an increased proportion of oral breathing, particularly in boys, relative to adults. Oral breathing can cause higher exposures than nasal breathing.
Figure 12. Long-term effects of Fine Particulate Matter
Recommendations
Reducing your exposure to air pollutants is important to reduce the risk of health effects. Improving indoor air quality will depend on your specific indoor or outdoor pollution source. Increasing ventilation is a good way to reduce indoor air pollution, only when the outdoor air is less polluted. It is not recommended to open windows to increase ventilation during wildfire events. HVAC systems should be set to recirculate air to prevent intake of outdoor wildfire smoke. Fans that vent to the outside, such as bathroom or kitchen vents, should also be turned off to prevent infiltration of outdoor wildfire smoke. You can also track the outdoor air quality to know when it is safe to open your windows for fresh air. You can view current air quality through the Puget Sound Clean Air Agency air quality map. The Puget Sound Clean Air Agency monitors air quality for King, Kitsap, Pierce, and Snohomish counties.
Increasing filtration through the use of portable air cleaners with HEPA filters can also improve indoor air quality. Windows should be closed when using HEPA filters to ensure the portable air cleaner can filter all of the air inside a room. You can learn more about how to select the best HEPA filter for your home on the Association of Home Appliance Manufacturers (AHAM) website.
Installing a MERV 13 filter in a buildings HVAC system is a good way to filter air in the entire building. However, not all building HVAC systems have the capability of using a MERV 13. Using a MERV 13 may harm your HVAC system if it is not capable of handling the increased air flow needed. Please be sure to verify your HVAC system has air flow capacity for a MERV 13 before installing.
Public Health – Seattle & King County has developed a website to help explain ways to improve indoor air in homes, businesses, schools, and other places where people gather indoors. Their education materials include a comprehensive guide with guidance on improving indoor air quality for building operators and business owners, but the information in the guide can be useful to everyone.
In addition, the Washington State Department of Health has developed recommendations for wildfire smoke and COVID-19 during the 2021 wildfire season. For more information about the overlapping health impacts of wildfire smoke and COVID-19 see their official recommendations. Please note the Healthy Air, Healthy Schools study did not investigate the impact of HEPA filters on the transmission of COVID-19.
References
- United States Environmental Protection Agency O. Particulate Matter (PM) Basics. Published April 19, 2016. Accessed August 29, 2021. https://www.epa.gov/pm-pollution/particulate-matter-pm-basics
- Steven PK Sternberg. Particulate Matter. In: Air Pollution: Engineering, Science and Policy. College Publishing; 2015:225-283.
- United States Environmental Protection Agency. Health effects of particulates and black carbon. Published online December 2013. https://www.epa.gov/sites/default/files/2014-05/documents/health-effect…
- United States Environmental Protection Agency O. NAAQS Table. Published April 10, 2014. Accessed August 29, 2021. https://www.epa.gov/criteria-air-pollutants/naaqs-table
- Puget Sound Clean Air Agency. Criteria Air Pollutants. Published 2018. https://www.pscleanair.org/163/Criteria-Air-Pollutants
- Li N, Georas S, Alexis N, et al. A work group report on ultrafine particles (American Academy of Allergy, Asthma & Immunology): Why ambient ultrafine and engineered nanoparticles should receive special attention for possible adverse health outcomes in human subjects. J Allergy Clin Immunol. 2016;138(2):386-396. doi:10.1016/j.jaci.2016.02.023
- Kwon HS, Ryu MH, Carlsten C. Ultrafine particles: unique physicochemical properties relevant to health and disease. Exp Mol Med. 2020;52(3):318-328. doi:10.1038/s12276-020-0405-1
- Pekkanen J, Kulmala M. Exposure assessment of ultrafine particles in epidemiologic time-series studies. Scand J Work Environ Health. 2004;30(2):9-18.
- Austin E, Xiang J, Gould TR, et al. Distinct Ultrafine Particle Profiles Associated with Aircraft and Roadway Traffic. Environ Sci Technol. 2021;55(5):2847-2858. doi:10.1021/acs.est.0c05933
- Hudda N, Simon MC, Zamore W, Brugge D, Durant JL. Aviation Emissions Impact Ambient Ultrafine Particle Concentrations in the Greater Boston Area. Environ Sci Technol. 2016;50(16):8514-8521. doi:10.1021/acs.est.6b01815
- Vu TV, Delgado-Saborit JM, Harrison RM. Review: Particle number size distributions from seven major sources and implications for source apportionment studies. Atmos Environ. 2015;122:114-132. doi:10.1016/j.atmosenv.2015.09.027
- Hudda N, Gould T, Hartin K, Larson TV, Fruin SA. Emissions from an International Airport Increase Particle Number Concentrations 4-fold at 10 km Downwind. Environ Sci Technol. 2014;48(12):6628-6635. doi:10.1021/es5001566
- United States Environmental Protection Agency. Integrated Science Assessment (ISA) for Particulate Matter. Published online December 2019. https://cfpub.epa.gov/ncea/isa/recordisplay.cfm?deid=347534
- Heyder J. Deposition of Inhaled Particles in the Human Respiratory Tract and Consequences for Regional Targeting in Respiratory Drug Delivery. Proc Am Thorac Soc. 2004;1(4):315-320. doi:10.1513/pats.200409-046TA
- Goldberg MS, Labrèche F, Weichenthal S, et al. The association between the incidence of postmenopausal breast cancer and concentrations at street-level of nitrogen dioxide and ultrafine particles. Environ Res. 2017;158:7-15. doi:10.1016/j.envres.2017.05.038
- Weichenthal S. Selected physiological effects of ultrafine particles in acute cardiovascular morbidity. Environ Res. 2012;115:26-36. doi:10.1016/j.envres.2012.03.001
- Ostro B, Hu J, Goldberg D, et al. Associations of Mortality with Long-Term Exposures to Fine and Ultrafine Particles, Species and Sources: Results from the California Teachers Study Cohort. Environ Health Perspect. 2015;123(6):549-556. doi:10.1289/ehp.1408565
- Weichenthal S, Lavigne E, Valois MF, et al. Spatial variations in ambient ultrafine particle concentrations and the risk of incident prostate cancer: A case-control study. Environ Res. 2017;156:374-380. doi:10.1016/j.envres.2017.03.035
- Weichenthal S, Van Ryswyk K, Goldstein A, Shekarrizfard M, Hatzopoulou M. Characterizing the spatial distribution of ambient ultrafine particles in Toronto, Canada: A land use regression model. Environ Pollut. 2016;208:241-248. doi:10.1016/j.envpol.2015.04.011
- Habre R, Zhou H, Eckel SP, et al. Short-term effects of airport-associated ultrafine particle exposure on lung function and inflammation in adults with asthma. Environ Int. 2018;118:48-59. doi:10.1016/j.envint.2018.05.031
- Lammers A, Janssen NAH, Boere AJF, et al. Effects of short-term exposures to ultrafine particles near an airport in healthy subjects. Environ Int. 2020;141:105779. doi:10.1016/j.envint.2020.105779
- Wing SE, Larson TV, Hudda N, Boonyarattaphan S, Fruin S, Ritz B. Preterm Birth among Infants Exposed to in Utero Ultrafine Particles from Aircraft Emissions. Environ Health Perspect. 2020;128(4):047002. doi:10.1289/EHP5732
- United States Environmental Protection Agency R 01. What is Particulate Matter? | Urban Environmental Program in New England. Accessed August 29, 2021. https://www3.epa.gov/region1/eco/uep/particulatematter.html
- Pope CA, Dockery DW. Health effects of fine particulate air pollution: lines that connect. J Air Waste Manag Assoc 1995. 2006;56(6):709-742. doi:10.1080/10473289.2006.10464485
- United States Environmental Protection Agency. Criteria Air Pollutants (America’s Children and the Environment). Published online 2015. https://www.epa.gov/sites/production/files/2015-10/documents/ace3_crite…