It was at the height of California’s worst drought on record that Esther Min saw for herself the power of data to help low-income families.
“People’s water bills were skyrocketing, wells were drying up, families were driving miles away to buy bottled water,” said Min, who was working on a water-access study in the Salinas Valley in 2014.
“I saw how we could partner with communities to gather data they could use to get the attention of policymakers,” said Min, now a PhD student in the UW Department of Environmental & Occupational Health Sciences (DEOHS).
Learn More
Access the mapping tool: fortress.wa.gov/doh/wtn/WTNIBL
Download our report: deohs.washington.edu/washington-state-envmap
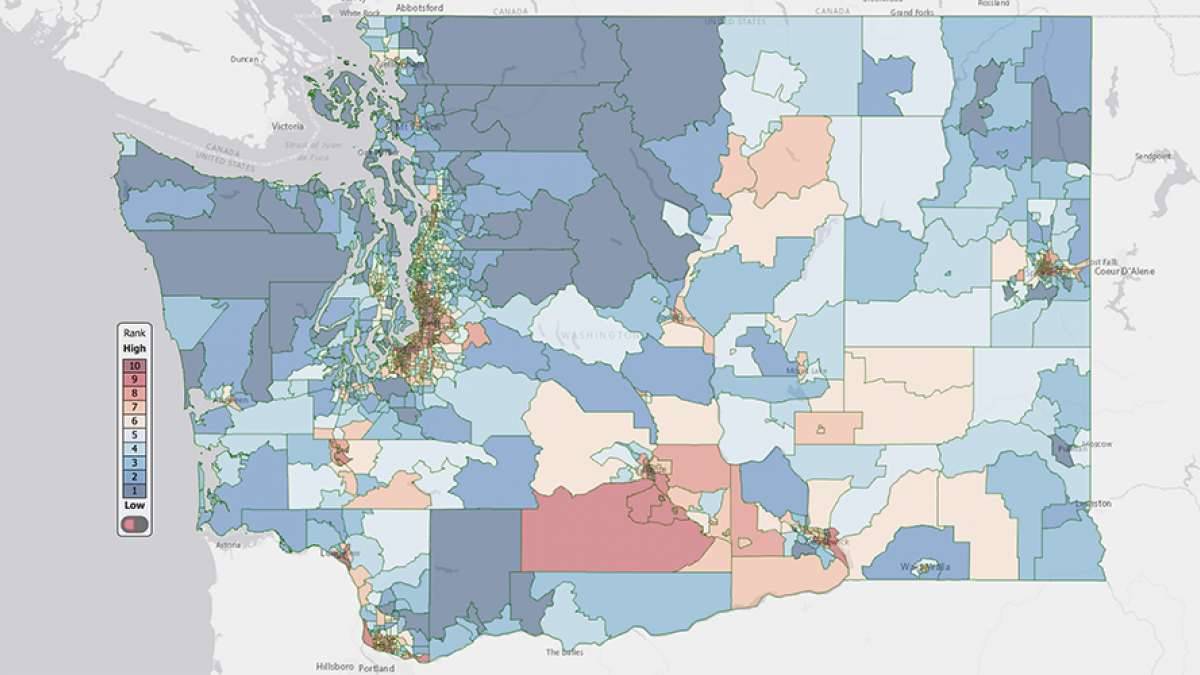
Now Min has helped create a new interactive map that shows for the first time how Washington communities rank on environmental health risk factors. The tool was launched this week by DEOHS and our partners.
The Washington Environmental Health Disparities Map shows that where you live, your income, race and language ability are among the factors that influence the risk you face from exposure to the harmful health effects of pollution.
A close-up view of health risk
The tool harnesses the most comprehensive data available to map 19 indicators of community health, combining measures of pollution, proximity to environmental hazards, population health and socioeconomic status into a score used to rank each of Washington’s 1,458 census tracts on their relative environmental health risk.

The result is a statewide view of the cumulative environmental health risks each neighborhood faces from pollution that may contribute to inequitable health outcomes and unequal access to healthy neighborhoods.
Which neighborhoods are at highest risk?
For example, imagine that you live on Capitol Hill in Seattle near the busy intersection of East Denny Way and East Olive Way.
The map shows that you live in a community that is ranked 10—among the areas in Washington that are most highly impacted by pollution and the most vulnerable to the resulting health effects.
The ranking reflects a variety of factors, from higher rates of poverty and unaffordable housing to more people with greater susceptibility to the health effects of pollution (for example, more people with cardiovascular disease).
It also reflects the close proximity of major roadways, Superfund sites, wastewater discharge and facilities using toxic substances.
Just 2 miles to the north
Now imagine that you live 2 miles away near Interlaken Park at the north end of Capitol Hill.
This neighborhood has an overall ranking of 1 on the map. The risk you face from environmental hazards drops significantly in this neighborhood, where people generally enjoy higher incomes, better health and living conditions and less overall exposure to pollution.
Similar disparities can be found in Spokane, Tacoma, Yakima, Vancouver and other population centers and between urban and rural areas across the state.

“The map makes clear that people in communities with lower incomes, less access to education and health care and poorer overall health also shoulder a disproportionate share of the burden of environmental pollution,” said DEOHS Chair Michael Yost.
A cross-sector partnership
The mapping tool was developed through a two-year, cross-sector collaboration among DEOHS; Front and Centered, a statewide environmental justice coalition; the Washington State Department of Health; the Washington State Department of Ecology; and the Puget Sound Clean Air Agency.
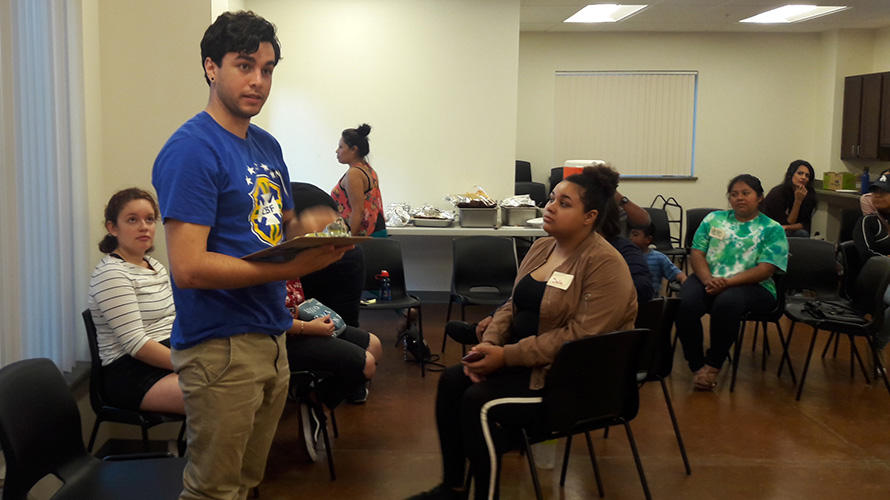
The map also reflects input from nearly 200 people across Washington who helped shape the tool through a series of 11 statewide “listening sessions.”
Those sessions included community groups representing immigrants, tribes, farmworkers, communities of color, the elderly and other groups disproportionately impacted by pollution.
Environmental justice for all
The tool reflects the commitment by DEOHS and our partners to work toward environmental justice and ensuring equitable access to healthy communities and safe workplaces.
“This tool can provide policymakers, community leaders and others with data to inform and shape policies and investments that reduce environmental health impacts on our communities,” said Edmund Seto, DEOHS associate professor who helped develop the tool.
“By harnessing data to pinpoint environmental inequality, it’s possible to show precisely where the state’s most highly impacted communities are concentrated and create customized solutions to reduce their risk,” Seto said.