Since it launched in 2019, Washington’s Environmental Health Disparities Map has been used to help decision-makers and government agencies work with communities to clean up contamination, improve buildings and electric grids, plant trees and many other projects.
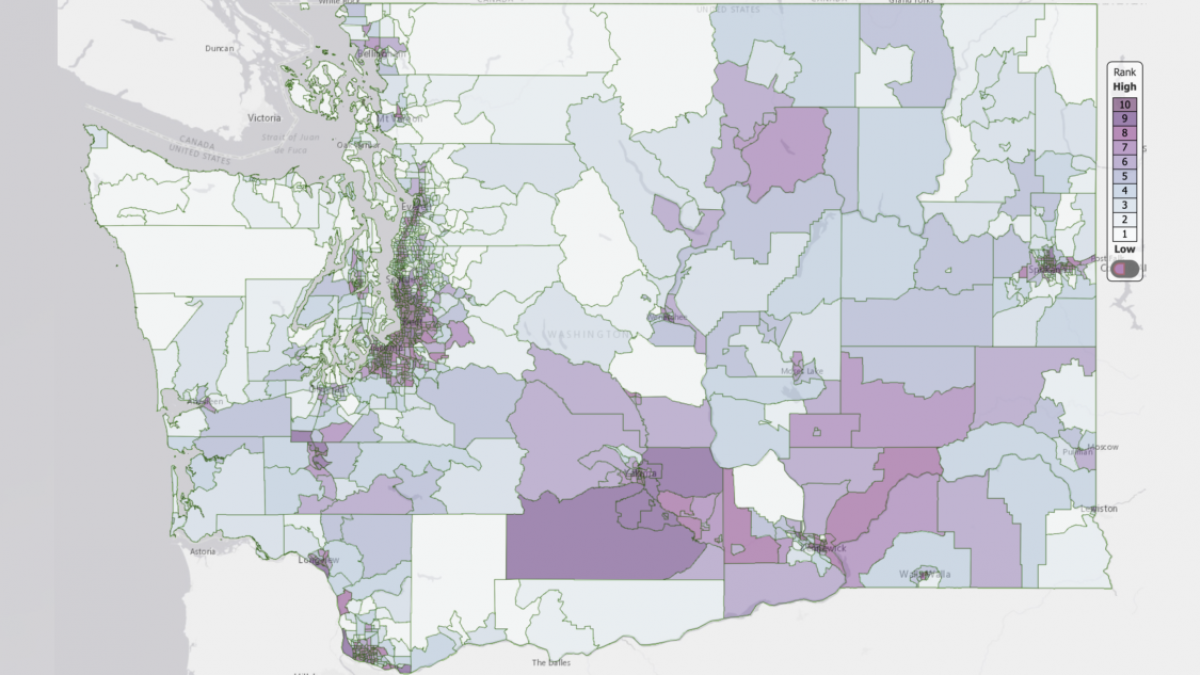
Using a complex matrix of data, this open-access, interactive map ranks Washington’s nearly 1,500 US census tracts by health risks due to environmental degradation and economic and health disparities.
The map acts as a guide for state agencies and the state Legislature to improve environmental and economic justice and is included in the state’s Healthy Environment for All (HEAL) Act.
Now the UW Department of Environmental & Occupational Health Sciences (DEOHS), one of the original partners in the creation of the map, is helping the Department of Health launch a new version, updating the data and methodology for how the map ranks vulnerable areas. The newly updated map went live on July 28.
The cumulative impact of pollution
.jpg)
“The original request for this map tool came from community members who felt that researchers and government programs were looking at either air or water quality, treating them as separate. But communities experience them together, and so they wanted to know if there was a better tool that could communicate the cumulative impact of pollution,” said Esther Min, a DEOHS clinical assistant professor who led the creation of the original map as well as its updated data and methods.
Min and DEOHS Associate Professor Edmund Seto formed a working group with Front and Centered, an environmental justice coalition of organizations rooted in communities of color, and several state agencies to publish the first version of the map.
“It brings together not just the harms to communities from pollution through an environmental health lens, but also shows a community’s vulnerability — what makes certain communities less resilient to environmental degradations,” Min said.
Map used by organizations statewide
Map users can create data visualizations to see environmental health risks and compare census tracts based on dozens of factors, such as existing levels of pollution from ozone concentration, PM2.5, diesel emissions, lead risks in homes, proximity to heavily trafficked roads, industrial or waste treatment facilities and Superfund sites.
Socioeconomic factors are also included, such as English proficiency, education levels, housing affordability and employment statistics, birthweights and prevalence of cardiovascular disease.
“The Environmental Health Disparities map is our most popular data product, used by organizations — big and small — across the state,” said Jennifer Sabel, manager of the Washington Tracking Network, which publishes the map. “With this version release, the data will be updated to reflect the changes that have happened since we first launched the map. This will lead to better-informed decisions that support health and environmental equity in our state,” she said.
According to the Department of Health, the map has already been used as a guide by state agencies when issuing grants or funding projects with the goal of improving health and the environment in an equitable manner.
In addition, Min said, “community groups are using the map for their own advocacy, saying ‘Look, our communities not only struggle with air pollution, but also here are all the other things that we really need to work on to eliminate disparities.’”
Read the full UW News story here.